Cohorts
Cohorts (also called phenotypes) are a set of patients that fulfill some inclusion and exclusion criteria for a duration of time. A cohort can also be defined independently of the other cohorts used in a study, thereby enabling their reuse for other studies. Data2Evidence enables building of cohorts using a cohort creator that provides instantaneous feedback on cohort sizes and other parameters.
Cohort overview
You can see a list of cohorts you have already created and saved in the cohort overview. To see cohorts that were shared with you, toggle the Shared Bookmarks on the top right of the page. Click on any of the cohort cards to load a cohort definition.
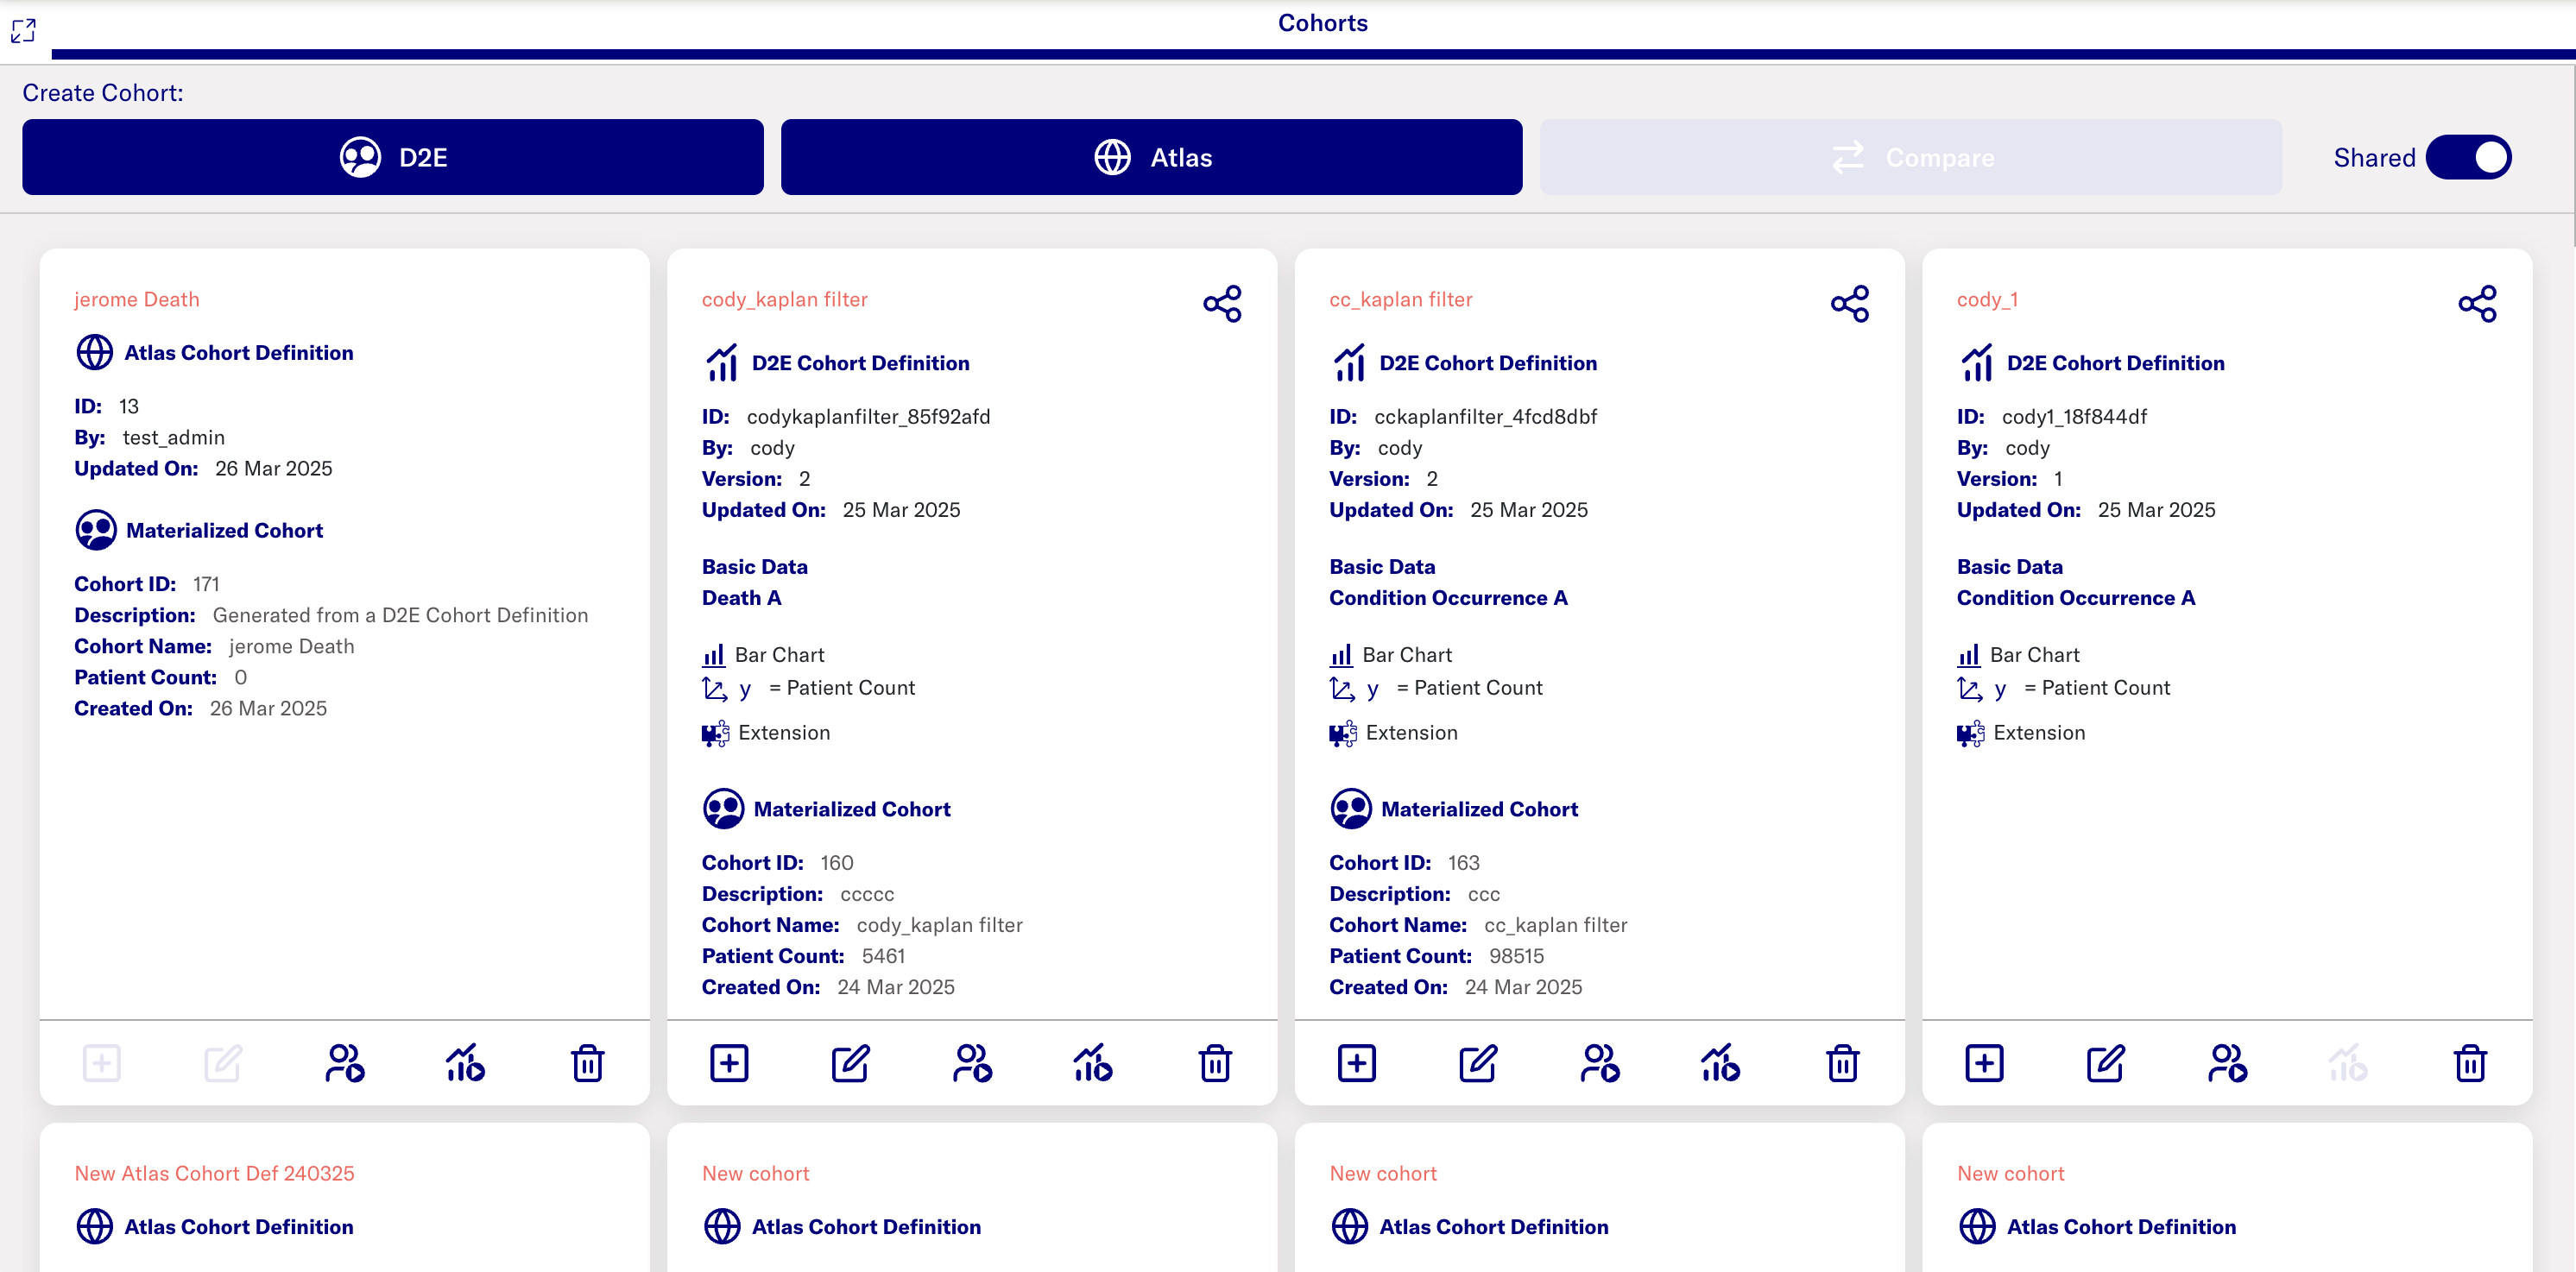
Cohort definition cards
The cohort definition cards have a few options displayed depending on the actions performed after saving the filters.
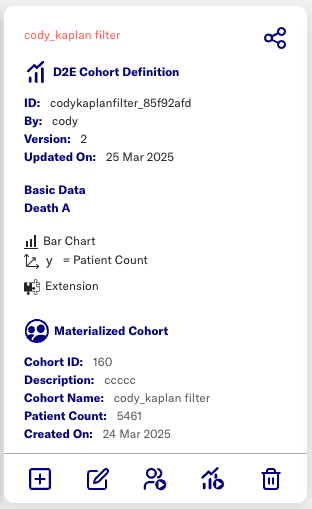
A shared icon is shown on top right of the card if it is a shared definition. If it is only avaiable to you, there will be no icon there. The cohort definition can be renamed using the edit button on the bottom.
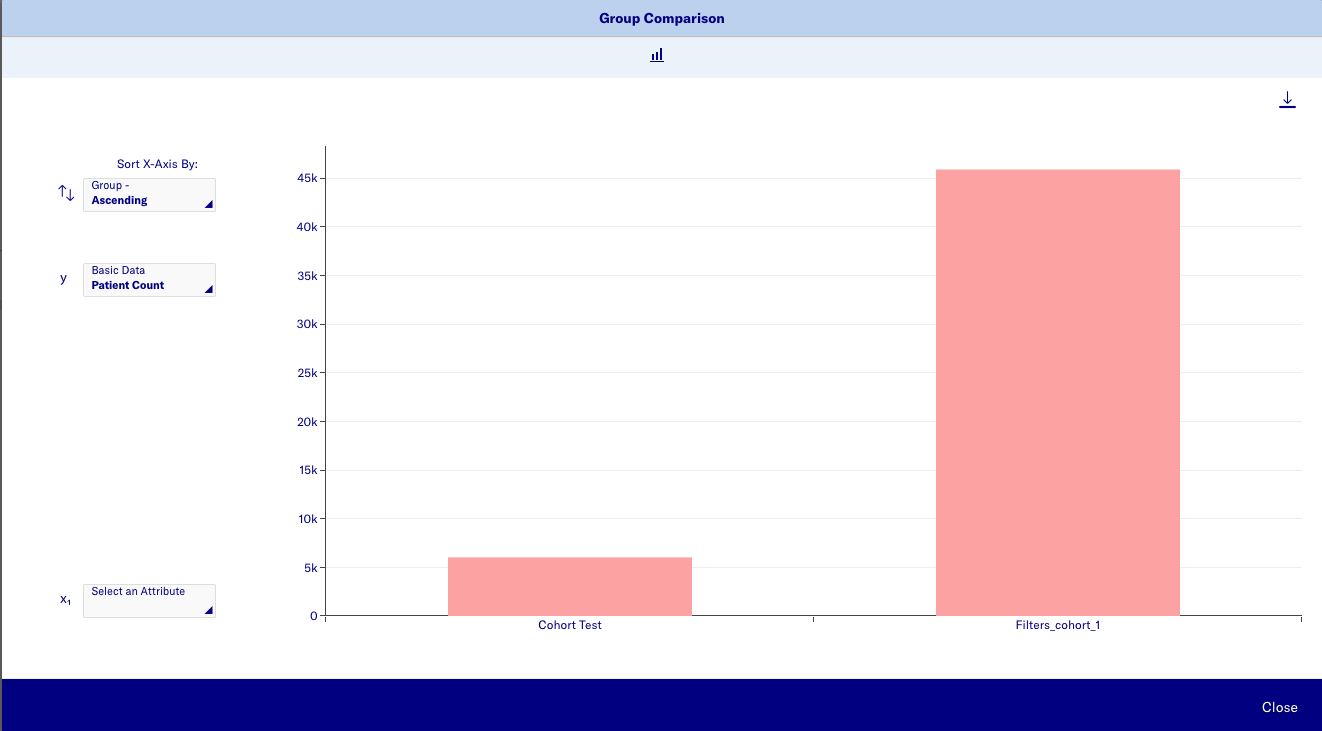
Group comparision
On the bottom row, the first plus symbol adds this cohort to a group comparision. Two or more cohorts can be compared against each other by adding to a group comparision and clicking the Compare button on top. A bar chart is generated showing a comparision of the cohorts against each other.
Saving patients to cohort
Patients who match the filter criteria can be saved to a cohort by using the "Materialize cohort" button. This creates a materialized cohort and details can be seen in the definition card. Multiple cohorts can be materialized across different datasets using the same cohort definition card.
Cohort quality dashboard
A cohort quality check can be run on a materialized cohort. This runs the same checks as the data quality dashboard, but on the subset of data included in the materialized cohort.
Delete cohort definition
Click on the delete icon to delete the cohort definition.
There are two ways to create a new cohort from here - a D2E cohort using the cohort builder solution or an ATLAS cohort using the ATLAS interface.
ATLAS cohort
Click on ATLAS button to load the ATLAS interface and start creating your cohort. More documentation on how to use ATLAS can be found here - ATLAS Wiki.
D2E cohort
The cohort builder (previously known as patient analytics) is a no-code, browser-based, interactive solution to build cohorts.
Basic concepts
Filter area
The filter area is on the left of the screen. Each filter is displayed in this area as a filter card. This is also where you specify and refine the filter criteria for creating your cohorts by adding filter cards. The default filters loaded depend on the installation.
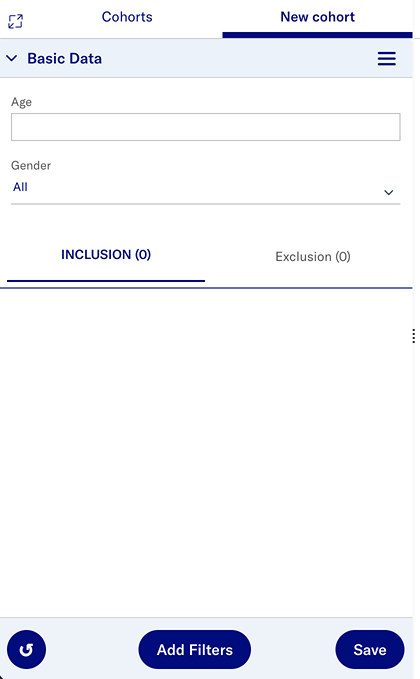
The filter cards in the Inclusion tab are the inclusion criteria and patients matching the criteria here are included in the cohort and the visualizations.
The filter cards in the Exclusion tab are the exclusion criteria and patients matching the criteria here are excluded from the cohort and the visualisations.
Click on the "Enter Fullscreen" icon on the top left of the filter area to maximise the filter area and hide the chart area.
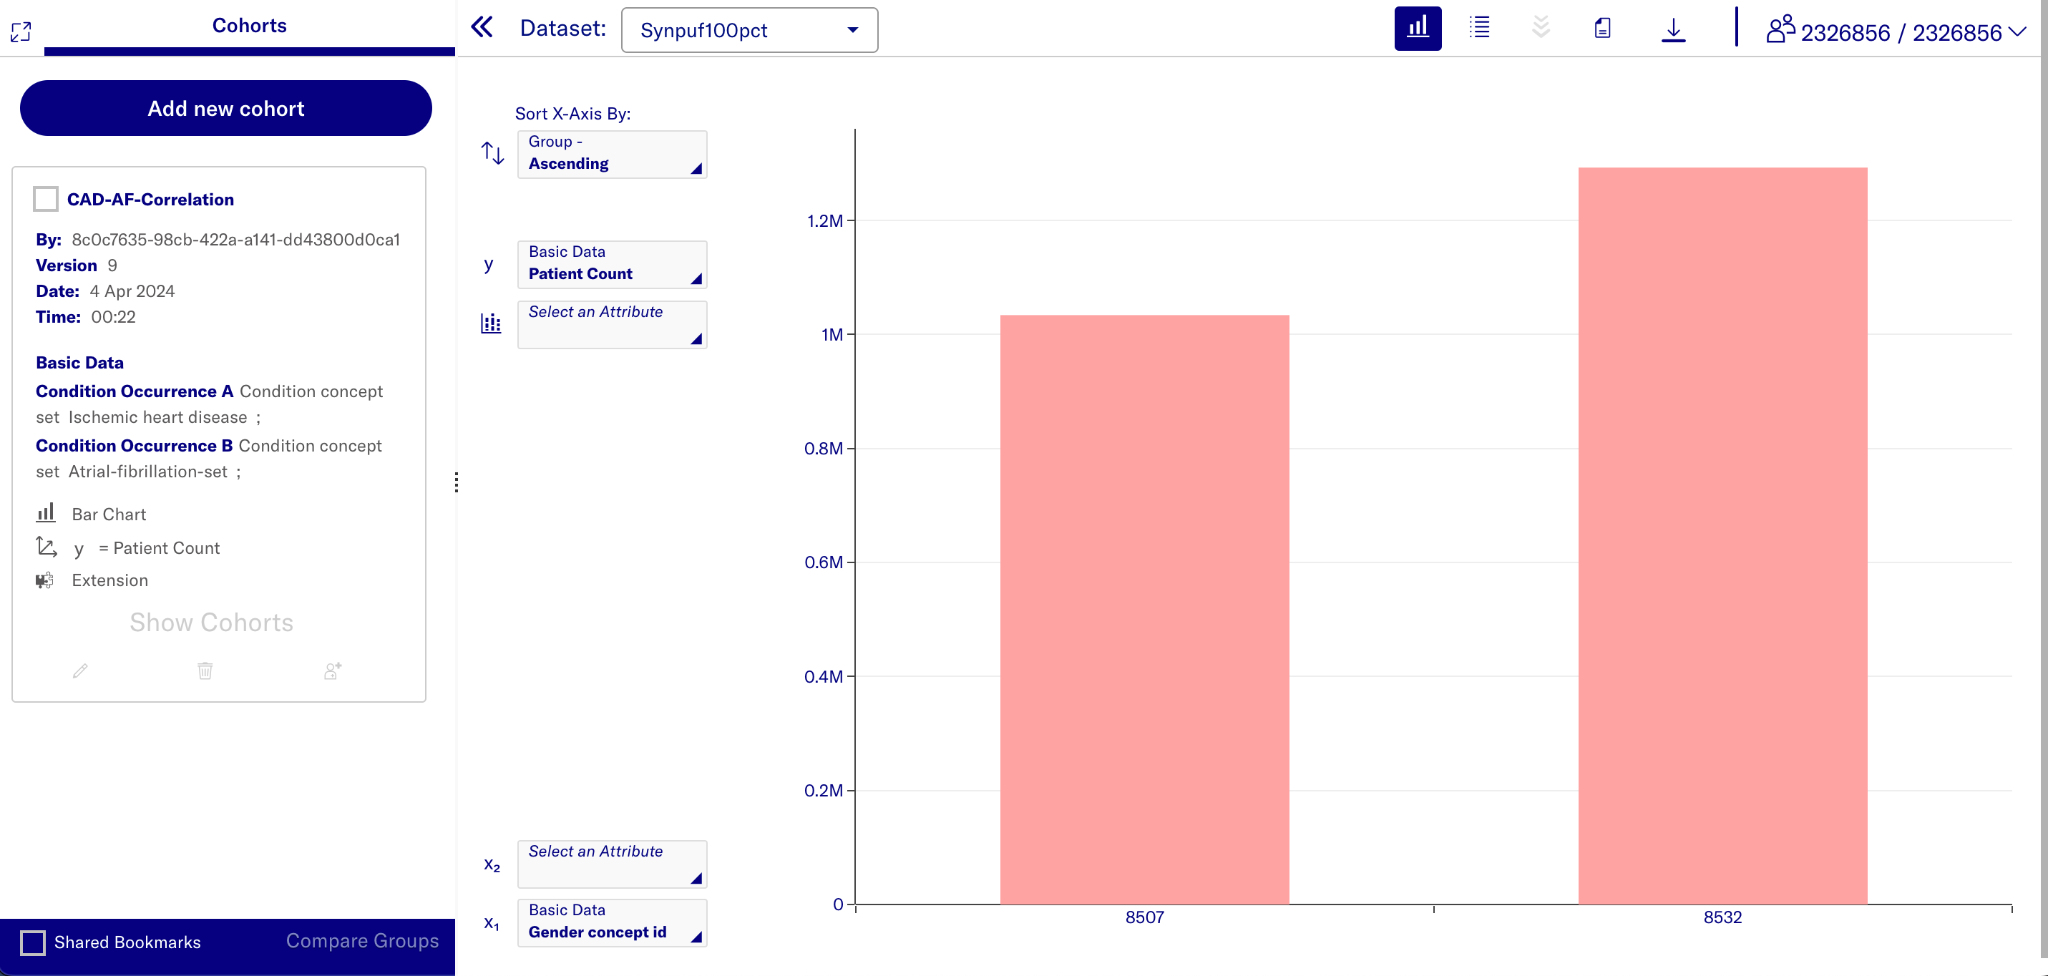
Chart area
The chart area is on the right of the screen. It displays a bar chart of the information, by default. It changes continuously based on the applied filters.
Click on the "Hide Filtering Area" icon on top left of the chart area to maximise the chart area and hide the filter area.
Patient count
The number on the top right of the screen is the current person count shown as the number of patients fulfilling the filtering criteria / total number of patients in the database.
Note that this may be a restricted number of patients, depending on your access rights.
Filter summary
A list of all filters applied can be seen by clicking on the "View filter summary" icon on the top right next to the download icon. The SQL code used to implement selected filters can be downloaded from here too. The cohort definition can be exported from here for import into ATLAS. Note that the conversion from D2E cohort defintion to ATLAS definition is not 1:1 and will result in a slightly different output in ATLAS.
Creating new cohort
Adding new filter card
Add new filter cards by clicking the Add filters button. A menu is displayed with the kinds of filter cards that can be added. Choose the domain of the filter card and subsequently choose the criteria for the card. The default fields are Concept set and Domain type concept set.
To add other criteria to this card, click the Menu icon (3 lines) at the top right of the card. You can remove, reset, or rename the filter card from this menu too.
Enter your search terms in the fields of the filter cards and the system will display a list of suggestions as you type. The number of values for any attribute displayed in the dropdown list is configured by the system administrator. If the dropdown displays the message: “Refine your search”, the number of suggestions exceeds the configured system limit. Continue entering text to further refine your search and see the suggestions displayed. If no suggestions are available, the message is “No suggestions available”.
These cards can be added in Inclusion or Exclusion tab depending on cohort design.
Boolean relationship between cards
If you add a new filter card after the first one has been configured, you will get the “AND” boolean relationship between the subsequent cards. This means that patients fulfilling both filter criteria will be included/excluded from the cohort. You can click this “AND” button to switch to the “OR” relationship which means that patients fitting either filter card criteria will be included/excluded from the cohort.
Temporal relationships
To add a temporal relationship between any filter cards, add the advanced time option from the Menu of one of the filter cards. Define the time interaction in terms of days, and in relation to the start and end dates of the interactions. There can also be an overlapping temporal relationship.
Save and reset filters
To save your filter cards, click the Save button and enter the details. This filter setting can also be shared with other users. Clicking the Reset icon resets everything in the cohort creator, including filter cards and previously added charts.
Restrictions on number of patients
If the filtering criteria does not have any relevant patients in the dataset or the number of patients in the cohort drops below a certain threshold, a warning message is displayed at the top of the screen.
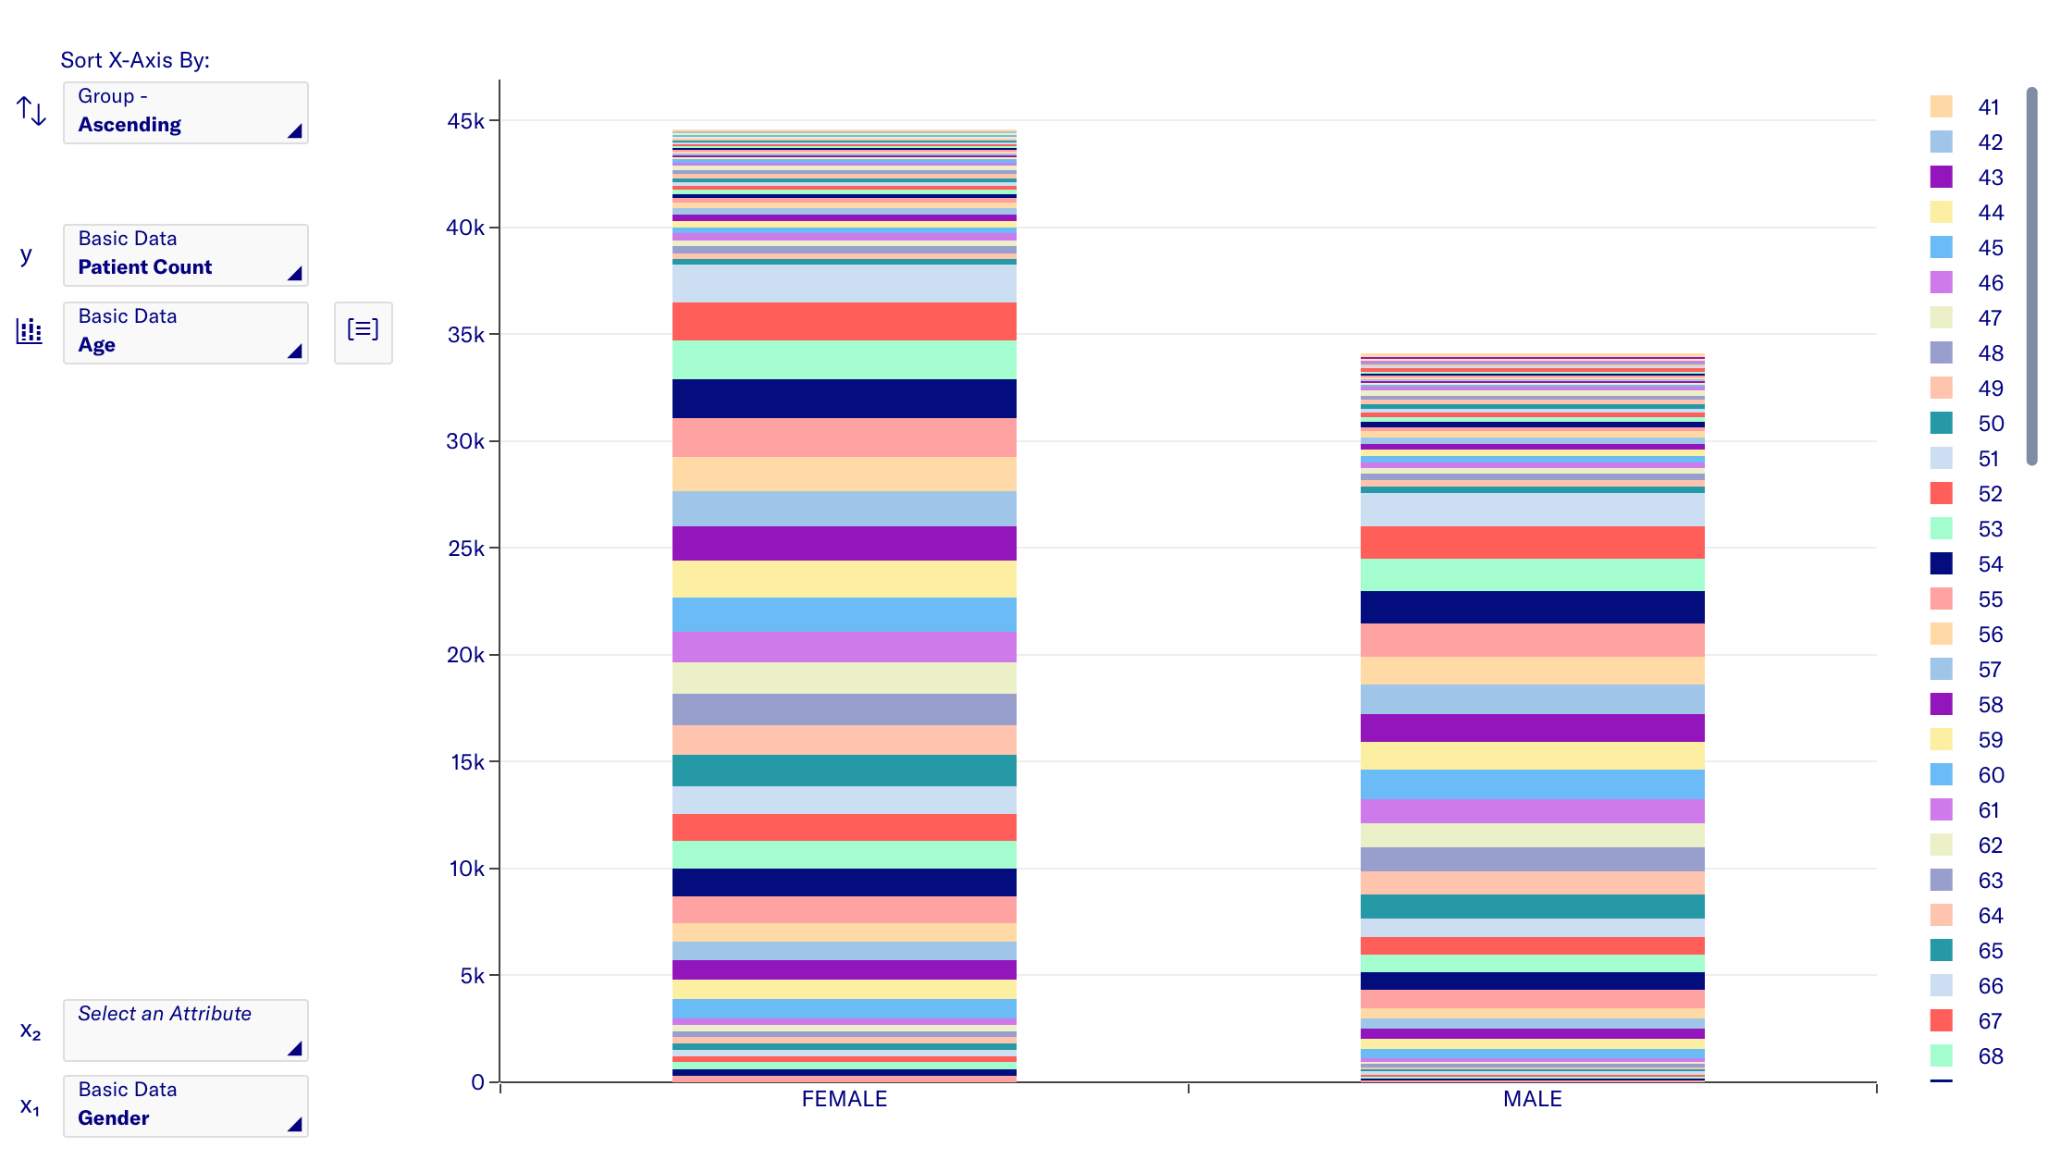
Chart actions
Move your cursor over a column to get a quick view of the attributes that form the group and its numeric value. You can also choose a second attribute for the x-axis to split the columns or for the y-axis to have a stacked chart. You can reset any of the selections using the dropdown menu.
Charts are only displayed for groups with a minimum number of patients. Results with fewer patients than the specified minimum are not displayed on the charts. This is to preserve privacy and avoids identifying individual patients based on the charts.
Adding filters from chart
You can also click on a column in the chart and click the “Filter by Selection” button to filter the data and add the attributes of the column to the filter cards.
Sorting and Binning
You can change the sorting of the groups on your x-axis by choosing the order in the dropdown of the x-axis. The default sorting is either alphabetical or numerical in ascending order. You can also reduce the number of groups by combining together groups within a range of numerical attributes. This is called binning. Use the binning icon next to the axis selector field and specify the bin size.
Export chart
To export chart data as a CSV or PNG file, use the Download option. These exports do not contain your filter information or underlying data.
Patient list
It is possible to view the patient list by clicking on the Patient list button, if it has been enabled. You might not be able to see all the patients that match your filter criteria in the patient list. The patient list does not show aggregated data – so you can only see the patients that you have permission allowed to access. You can edit this patient list table to include additional criteria and interactions to show.
Export data
The table can be downloaded, if enabled by administrator. Choose "Export to ZIP File" to export a zip of multiple CSV files. A CSV file is exported for each set of interaction type columns currently displayed in your patient list. These CSV files contain details of the attributes shown for each interaction type as well as the patient ID for each patient.
These CSV files may be used in external applications for further analysis.